TradingKey - After the market close on September 2 ET, Broadcom (AVGO) reported its third-quarter financial results. The figures showed that AI revenue maintained strong growth, yet the stock price failed to rally in tandem, dropping over 6% in after-hours trading at one point. What was the reason? Can Broadcom's stock price still rise?
Why Broadcom Stock Is Falling: AI Revenue Grew 221%, but Q4 Guidance and Gross Margin Weigh on Shares
According to the earnings report, Broadcom's fiscal 2026 third-quarter revenue reached a record $29.591 billion, up 86% year-over-year and beating market expectations of around $29.3 billion. Adjusted EPS came in at $3.32, up 96% year-over-year, also surpassing market expectations of around $3.24. Free cash flow reached $13.7 billion, up 95% year-over-year and accounting for 46% of quarterly revenue, demonstrating that the company maintains strong cash generation capabilities while rapidly expanding its AI business.
AI semiconductors remained the biggest highlight of this earnings report. Third-quarter AI semiconductor revenue reached $16.7 billion, representing a 221% year-over-year increase and a 54% sequential rise, exceeding the company's previous target of approximately $16.0 billion. CEO Hock Tan stated that demand for custom AI accelerators and AI networking remains exceptionally strong, and projected fourth-quarter AI semiconductor revenue to reach $21.7 billion, up 236% year-over-year.
Meanwhile, management stated that current supply is sufficient to support AI semiconductor revenue of approximately $115 billion in fiscal 2027, and expects it to double further to around $230 billion in fiscal 2028.
However, it is worth noting that Broadcom's Q4 guidance and gross margin fell short of market expectations, which was the primary driver behind the stock's after-hours decline. Broadcom expects fourth-quarter total revenue of approximately $34.8 billion, up 93% year-over-year, slightly missing market expectations of around $35.0 billion. Meanwhile, as custom XPUs continue to account for a larger share of revenue, the company expects its Q4 consolidated gross margin to be around 73%, down from 78% in the same period last year. Management explained that the main reason is that next-generation XPUs incorporate more high-cost memory, and the rapid growth of the AI business is diluting the overall gross margin.
Broadcom stock price daily chart, Source: TradingView
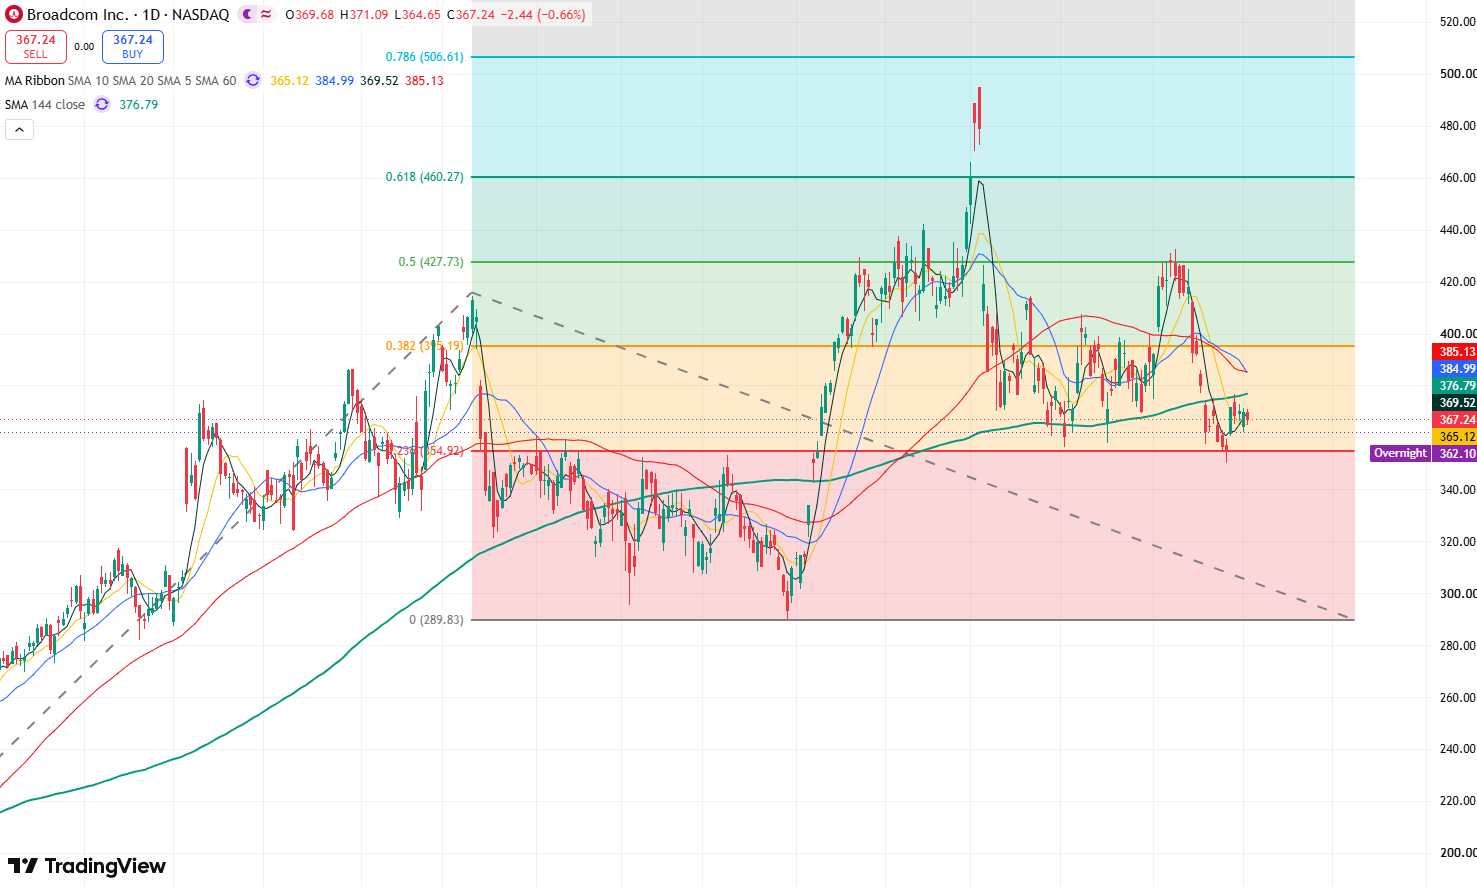
According to the daily chart of Broadcom's stock price, the stock fell continuously in August after rebounding to $432.73 and briefly broke below $356, the lower boundary of its previous consolidation range, indicating that market sentiment leaned bearish. However, while the stock price once fell to around $350 on August 26, the closing price that day still held firm above the 0.236 Fibonacci retracement level of $355, showing that this position offers a degree of support.
Currently, the stock price has fallen below the 144-day moving average, indicating that market bearish momentum has strengthened. Although the stock has rebounded recently, it remains under pressure below the 144-day moving average, demonstrating that bearish sentiment dominates the market and the stock price could still decline in the short term.
On the downside, the primary support level to watch below is $350. If this level fails to hold, the stock price may enter a deeper correction phase, potentially testing $300 to the downside, with the next level lower being the March low of $289.96.
Conversely, if the stock price confirms a bottom above $350, it is expected to see a technical recovery rebound. The primary target for the rebound will be testing $376.59 to the upside. A breakout above this level will open upside space toward $400. Only if the stock price stands firm above $400 can it be expected to continue challenging the key resistance level at $430, and only a breakout above $430 would offer hope of resuming the upward trend.
Find out more