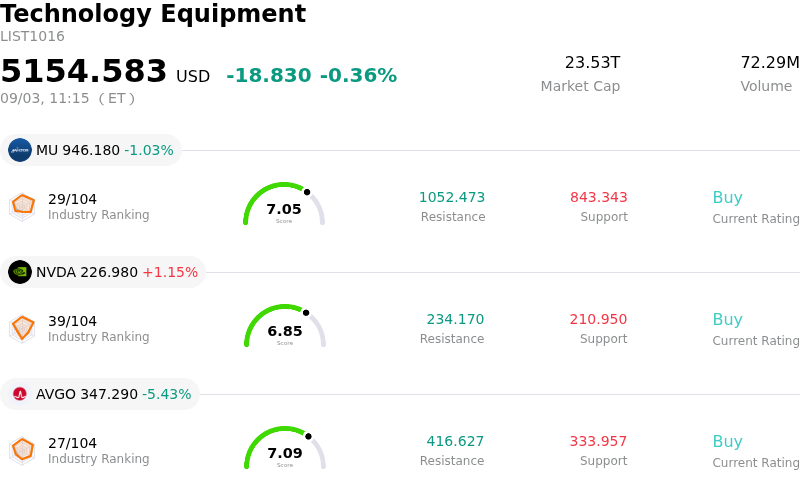
Dell Technologies Inc (DELL) moved up by 4.68%. The Technology Equipment sector is down by 0.36%. The company outperformed the industry. Top 3 stocks by turnover in the sector: Micron Technology Inc (MU) down 1.03%; NVIDIA Corp (NVDA) up 1.15%; Broadcom Inc (AVGO) down 5.47%.
What is driving Dell Technologies Inc (DELL)’s stock price up today?
Dell Technologies experienced upward momentum accompanied by heightened intraday volatility as the market continued to digest the company's monumental fiscal second-quarter financial results and substantial forward guidance increase. Dell reported record quarterly top-line revenue growth driven primarily by unprecedented demand for its artificial intelligence infrastructure and data center server hardware. Both quarterly revenue and adjusted earnings per share comfortably surpassed Wall Street consensus expectations. More importantly, management delivered a massive upward revision to its full-year outlook, significantly raising revenue and profit projections for the full fiscal year alongside third-quarter targets that exceeded analyst forecasts by a wide margin.
The primary operational driver behind the bullish repricing remains the accelerating enterprise adoption of AI hardware solutions. Within the Infrastructure Solutions Group, AI-optimized server sales doubled year over year, while orders reached extraordinary levels during the quarter. This surging demand expanded Dell's total AI server backlog to a historic high, providing institutional investors with extended visibility into multi-year revenue compounding. Additionally, strength extended beyond specialized AI systems into traditional enterprise servers, networking, and high-margin storage solutions, signaling that broader corporate IT capital expenditures are recovering in tandem with generative AI deployments.
Wall Street research departments responded to the quarterly performance with a widespread wave of price target increases and rating upgrades. Key investment banks highlighted Dell's end-to-end capabilities, global supply chain scale, and expanding market share in neocloud, sovereign, and enterprise AI buildouts. Analysts from major firms significantly elevated their target valuations, concluding that Dell's earnings power has undergone a structural step-change rather than a temporary cyclical spike. The overwhelming consensus shifts forced systematic algorithms and fundamental fund managers to re-weight their portfolio holdings upward.
Intraday trading reflected pronounced volatility as market participants balanced aggressive institutional buying against localized profit-taking following the stock's massive rally in the preceding session. After breaking out above multi-month consolidation levels, brief periods of price pressure were absorbed by buyers establishing exposure to the AI hardware cycle. While component cost inflation in memory technologies remains a tactical risk factor for gross margins, the sheer scale of high-margin backlog conversions and ongoing capital return programs sustained overall momentum.
Technical Analysis of Dell Technologies Inc (DELL)
Technically, Dell Technologies Inc (DELL) shows a MACD (12,26,9) value of 5.103, indicating a buy signal. The RSI at 62.372 suggests neutral condition and the Williams %R at 1.521 suggests overbought condition. Please monitor closely.
Media Coverage of Dell Technologies Inc (DELL)
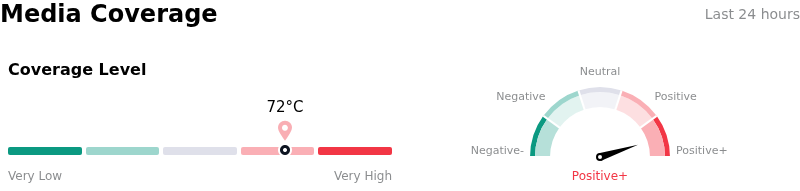
In terms of media coverage, Dell Technologies Inc (DELL) shows a coverage score of 72, indicating a high level of media attention. The overall market sentiment index is currently in extremely bullish zone.
Fundamental Analysis of Dell Technologies Inc (DELL)
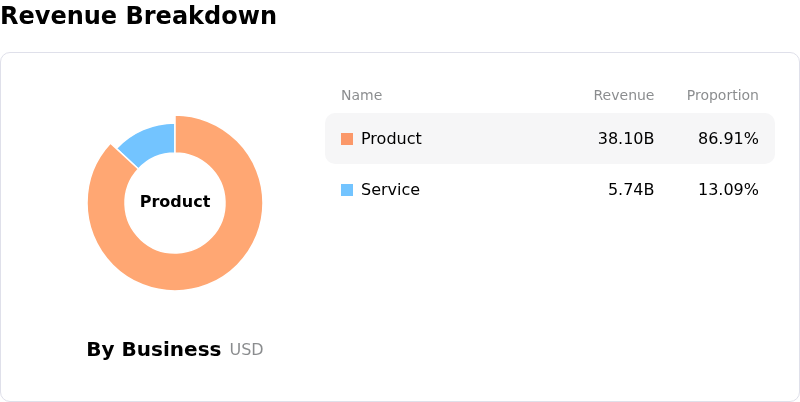
Dell Technologies Inc (DELL) is in the Technology Equipment industry. Its latest annual revenue is $113.54B, ranking 2 in the industry. The net profit is $5.94B, ranking 4 in the industry. Company Profile
Over the past month, multiple analysts have rated the company as Buy, with an average price target of $550.55, a high of $700.00, and a low of $464.56.
More details about Dell Technologies Inc (DELL)
Company Specific Risks:
- Working Capital Drag and Cash Flow Divergence: Following its fiscal Q2 2027 earnings release, Dell reported a 13% year-over-year decline in quarterly operating cash flow to $2.2 billion, significantly trailing net income of $4.1 billion as inventory doubled over six months to $21.3 billion to support AI hardware production.
- Capital Distribution Outpacing Operating Cash Flow: The company returned $4.3 billion to shareholders through dividends and share repurchases during Q2, which exceeded its $2.2 billion operating cash generation by nearly two times and required drawing on balance sheet liquidity.
- Supply Chain Constraints and Memory Inflation: Executive commentary highlighted ongoing supply bottlenecks and rising component costs in DRAM, NAND, and AI rack-scale infrastructure, creating execution risk and potential margin headwinds in converting its $95 billion backlog.
- Insider Dispositions and Valuation Sensitivity: Following a massive multi-fold stock rally to new historic highs near $492, persistent Class C share sales by major private equity insiders, including Silver Lake entities and board directors, pose market overhead and increase susceptibility to profit-taking.
Find out more