TradingKey - NVIDIA starts the month at around $ 224.41, just above the sweet spot of the $ 224.28 chart reference point. It showed a 3.2% gain on September 2. The Higher-low structure is preserved as support begins at the $215 – $218 range. The bulls still need to overcome the $228–$230.49 resistance in order to signify the next leg up for the stock. Record breaking Q2 earnings, MediaTek’s adoption of NVLink Fusion, as well as new evidence of large pre-commitments for AI computing keep the demand side of the story positive.
Record Q2 Results Still Anchor the Bull Case
NVIDIA reported a jump of 106% year over year (YoY) for the current fiscal quarter ending in Q2 of 2027, as reported on August 26. During the same reporting period, Data Center revenue was up an impressive 117%. GAAP operating income rose by 124% to $63.73 billion for the period, with non-GAAP EPS arriving at $2.22.
Management’s outlook was to report $108 billion of revenue, plus or minus 2%, for Q3, but the guidance assumes no Data Center compute revenue from China. Th eshould not rely on a considerable China opening for the business.
Rubin Is Already Supporting the Next Growth Cycle
Vera Rubin is ramping into full production, with racks already running at CoreWeave, Google Cloud, Microsoft Azure, Oracle Cloud Infrastructure and Nebius. With a focus on rack-scale AI inference factories, NVIDIA sells comprehensive compute factories, rather than selling AI inference/compute factories.
This enhances the value per system deployed and makes it more challenging to displace the systems.
MediaTek Deal Expands NVIDIA Into Custom Silicon
The most significant development in late-August was NVIDIA’s $3.5 billion investment in MediaTek through a convertible-bond offering. MediaTek will deploy NVLink Fusion, allowing customers to develop custom XPUs that integrate with NVIDIA’s rack-scale AI infrastructure.
This is relevant strategically because hyperscalers are starting to prefer proprietary accelerators, and NVIDIA is attempting to incorporate these chips into their increasingly competing ecosystem.
Fresh AI Compute Deals Reinforce Demand
Lambda's reported $35 billion cloud deal with Anthropic adds to already established buying interest for frontier AI labs. This deal reflects an industry-wide paradigm shift towards the spending of infrastructure dollars.
The trends that Broadcom's latest earnings call support are further positive indicators for the broader field of AI. With FY27 AI revenue expectations around $115 billion, Broadcom reported $16.7 billion of Q3 AI chip sales.
The Biggest Risks Are Margins and Financing Exposure
These trends present the greatest risk of margin compression and credit exposure.
While NVIDIA CFO, Colette Kress, expects Q3 gross margins to decrease from 75% to 74%, plus or minus 50 basis points due to memory, networking and packaging costs during the Rubin ramp, this would not be cause for concern in the context of normal profit margins.
However there is a substantial financial commitment on behalf of NVIDIA to support AI customers and infrastructure developers. This creates potential credit, concentration, and capital allocation risk which were previously of little to no concern.
NVIDIA Technical Analysis: $230.49 Is the Decisive Barrier
NVDA is trading at $224.41, which is just above the chart reference level of $224.28. $224.41 was the September 2 closing price. The buyers are keeping the sequence of high lows intact by defending the rising trendline and the moving average at $218.56.
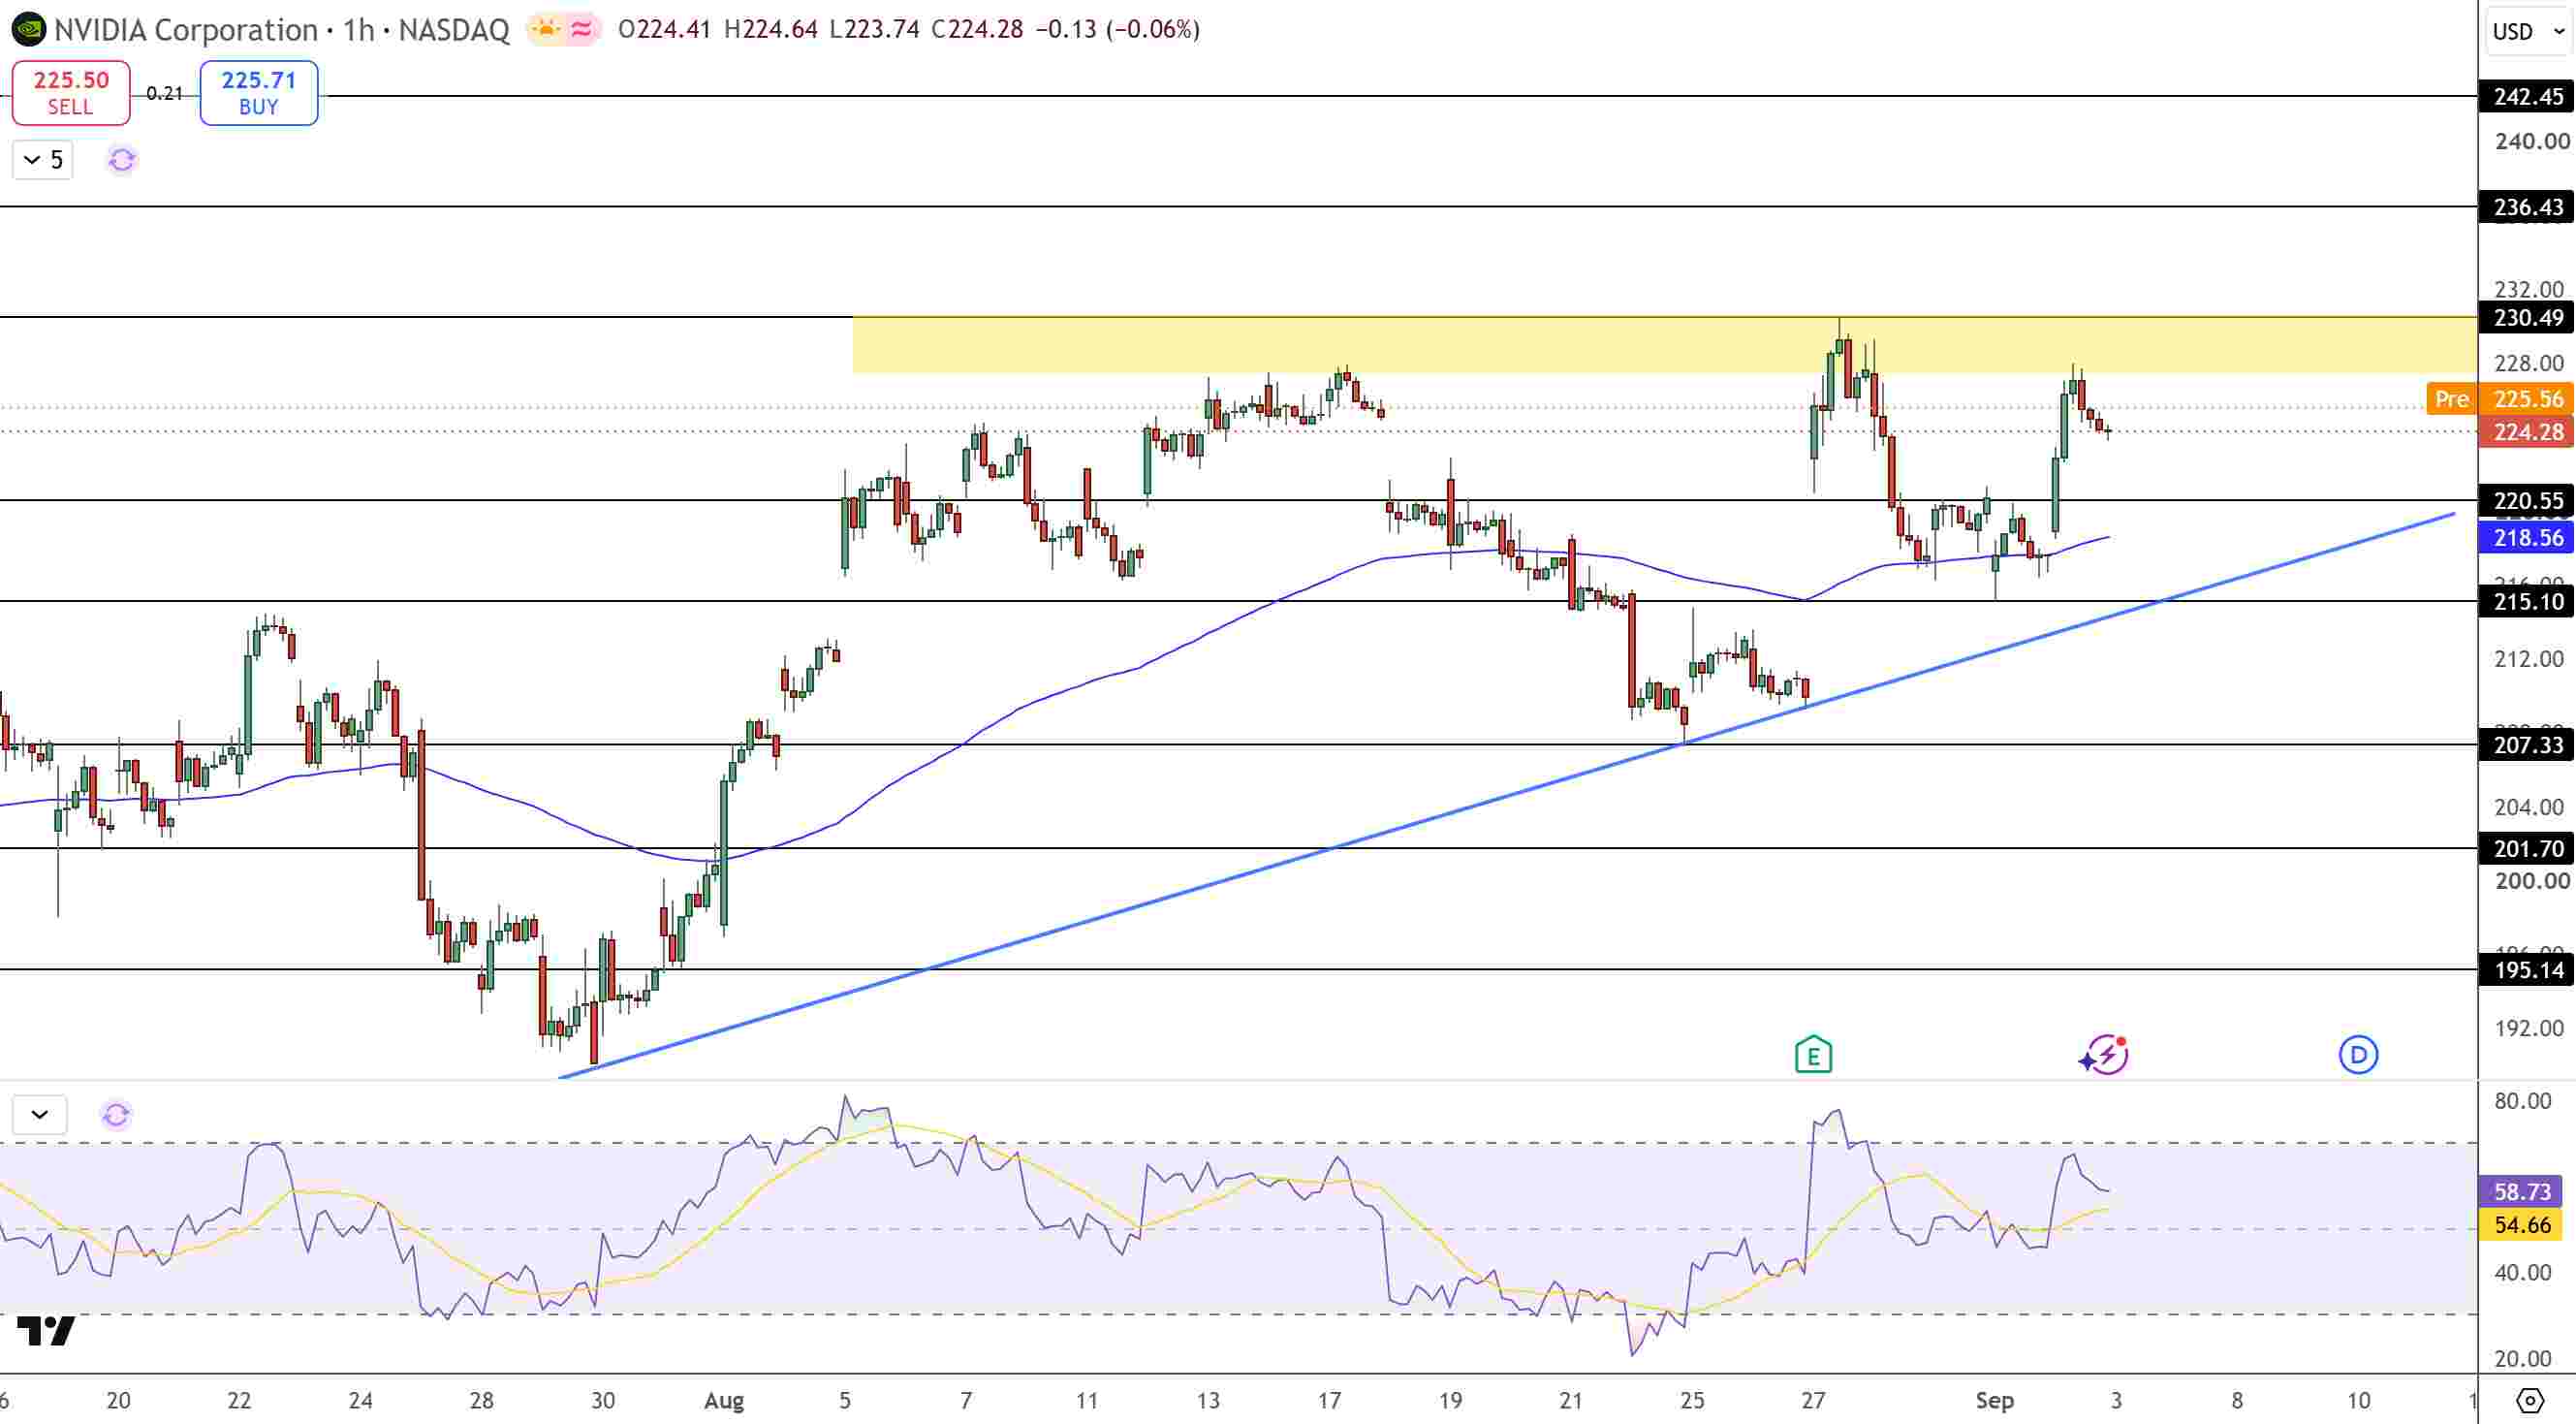
NVIDIA Stock Price Chart - Source: Tradingview
The immediate level of resistance is $228-$230.49. A break above this level on a continuation basis would expose levels at $236.43, $242.45 and upward to $248.73.
RSI at the 59 level is indicating moderate buying pressure and is above the 55 level, which is the signal line and is also not in an overbought position. On the downside, levels of interest are at $220.55, then at $218.56, and then $215.10. A breach of this level would also remove the defense of the high lows and would expose levels at $207.33.
Key Levels
· Current price: Approximately at $224.41
· Immediate support: $220.55
· Moving average support: $218.56
· Structural support: $215.10
· Breakout resistance: $228-$230.49
· Upside targets: $236.43, $242.45, $248.73
· Downside target: $207.33
· RSI: Approximately, at 59, bullish but not overbought
Why does NVIDIA still have strong AI demand?
In terms of infrastructure spending, it does not appear to be cyclical with a large customer or product focus. Broad, strong AI results have been reported by Broadcom. There are impressive cloud commitments, robust Data Center growth, and the Rubin production.
What level confirms another NVDA breakout?
On a sustained basis, a break above $230.49 would provide the breaks of the resistance zone and confirmation of a move toward $236.43 and $242.45.
Bottom Line
NVIDIA's fundamentals still look great but the stock needs to breach $230.49 to highlight another leg upward on technical analysis. The demand complement continues with Rubin, MediaTek, Anthropic, and even broader spending on AI chips. NVDA is still cautious bullish while $215.10 holds support; $236-$242 is the next area in focus if there is a clear breakout.
Find out more